Discovering your Sources of Delay and Waste
.png)
Are you ready to optimise your delivery ecosystem today?
book demoThere is a concept of the Lean Decision Filter by David J Anderson, who is the leader of the Kanban movement. To summarise:
- Value trumps flow
- Flow trumps waste elimination
- Waste elimination trumps economy of scale
We’ve previously covered Flow in an earlier blog. Today we’ll look at Waste Elimination. In Lean there is a concept on the ‘7 wastes’. This is Flomatika’s take on it, applied to knowledge work as opposed to manufacturing. We have an accordion with a series of widgets dedicated to highlighting your sources of delay and waste.
WIP Excess
Out-of-control WIP is one of the most common causes affecting delivery systems. When things are busy and stressful, it feels faster to start more work than it is to “stop starting, and start finishing”. Learning to control WIP is vital, but what is the right WIP level?
Previously this has been very difficult to answer. It depends on your context. At Flomatika we’ve taken an objective approach. Based upon the concept that to promote flow, your system should be in a state of equilibrium. Your in flow should match your out flow. We know your outflow, as that is essentially your throughput, what you are actually able to deliver. Therefore, your target WIP should match your throughput. We can then see what your WIP Excess is by calculating how many your actual WIP is over the target WIP.
It’s important to note that this is not an exact science, but an indicator. If your WIP is over by one or two items, that’s probably not that big an influence on your flow, and there are probably other areas you should focus on. However if it’s over by order of magnitudes, then it’s certainly an area you'll want to look into in more detail.
.png)
Stale Work
Items that have started but haven’t had any activity for a long time are known as Stale Items. For example, a User Stories that has started hasn’t had any activity on it for over 30 days. (The number of days is configura
Having a high percentage of stale items in your system means the process is dysfunctional or heading in that direction. Teams in with high number of stale items are possibly:
- Frequently context switching
- Compromising on quality
- Burning team members out
- Burning customer’s trust
Having visibility on the number of stale items in your system will give you an indication if your delivery system is falling into dysfunction.
.png)
In the above example, you can see over a quarter of your items in WIP have gone ‘stale’.
Blockers
How many blocked items do you have in your system? These obviously interrupt the flow of work moving through your system, impacting your flow efficiency and WIP Age (therefore eventually Lead Time). Consequently, to increase flow, these items need to be unblocked as soon as possible.
What is the percentage of blocked items versus your overall WIP? If there is a large number of blocked items, it’s a sign you might have a systemic problem that needs to be addressed.
.png)
Discards
As part of any triage process, it’s common to discard items from your system. Discards before they are worked on indicate a healthy refinement process. (Although if this number is extremely large, it could also be an indication you have too many items as options and your upstream system is being overwhelmed.)
.png)
Discards after they have started, however, is an expensive form of waste in your system as you have potentially expended working days on that are now thrown away.
.png)
It’s important to have visibility on discarded items, both before and after the commitment point, to help you understand the health of your triage.
Flow Debt
This is a leading indicator around the health of your delivery system. It’s comparing your Lead time (what you’ve been able to produce in your recent history) with what’s currently in WIP, and how does its WIP Age compare?
If this number is greater than 1.0, then your system’s performance is degrading. What you are working on now is already taking longer than what you’ve been able to deliver in your recent past.
If your Flow Debt is 2.0X, then your delivery system is already twice as slow as what you’ve been able to deliver recently. That’s also assuming you complete those items now. It’s likely that these items will still continue to age before they can be moved to Done.
If your Flow Debt is less than 1.0, then your system has a chance of improving. The items being worked on now have a WIP age less than the lead time of the recent items you have delivered.
.png)
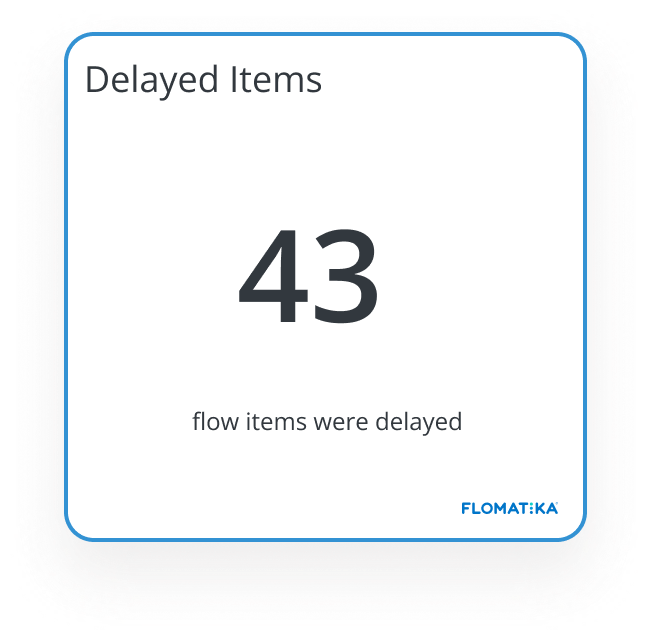
Delayed Items
These are items that have at some point started (moved past the commitment point), but subsequently has been moved back to a workflow step before the commitment point (eg To Do or Backlog). There was a conscious decision to start the work, but at some point, a conscious decision was also made to ‘delay’ the work and move it back to an earlier point in the workflow.
It’s Important to have visibility on these items, as they are continuing to accumulate WIP age, as a commitment has been made and their WIP Age (consequently Lead Time) is being calculated from the date they were first moved past the commitment point.
You can read more about delayed items from the Delayed Items: What It Means and How We Handle It blog.
Top Wait Steps
Items spending time in any of your wait steps in your workflow aren’t being actively worked on. By definition these are the steps that lower your flow efficiency. To increase flow efficiency, you want to reduce the time spent in your wait steps. The best way to tackle that is to firstly identify what are the biggest queues in your system, and find ways to reduce or eliminate these.
This will result in an increase to flow efficiency, resulting in shorter lead times, and increased throughput.
.png)
Sources of Delay and Waste
There you have it, Flomatika’s take on the 7 wastes you should keep an eye on in your delivery system, applied to knowledge work. Some of these come along with ‘traffic light’ indicators to show which should be a concern to be investigated further. Some of these are leading indicators to give you an early warning of concerns to come so you can act sooner.
Other blogs you may be interested in:
- 5 Metrics you Probably Haven't Thought About
- 5 More Metrics to Help Assess the Health of Your Delivery
- Delayed Items: What It Means And How We Handle It
- Understanding Flow In Your System
Be able to quickly identify your team's sources of delay and waste with Flomatika.
Book a demo with us today!


%20(1).jpg)
.jpg)
